Emissions
Direct emissions
| Direct GHG emissions (Scope 1) | Key figures |
|---|---|
| Gross volume of direct GHG emissions in the 2021 reporting year | 5,411 tonnes CO2e*1 |
| Gross volume of direct GHG emissions in the base year (2019) | 9,035 tonnes CO2e*2 |
| Percentage change 2019 to 2021 | −40% |
*1 Scope 1 Germany and EU sites in the 2021 reporting year, CO2e = CO2 equivalents
*2 Source: CO2 Report Bionorica 2019, EcoCockpit
Greenhouse gases in CO2 equivalents (CO2e)*3 were included in the calculation. The base year used is 2019, as this was the first year in which a CO2 report was prepared for Bionorica with the help of an external service provider. The decrease in direct GHG emissions from 2019 to 2021 is due to the fact that the diesel consumption of the Bionorica fleet decreased significantly as a result of the coronavirus pandemic. Furthermore, the first calculation in 2019 was based on EcoCockpit, while the calculation in 2021 is based on DEFRA, thus new and more accurate baseline values were achieved.
The sources of emission factors for the 2021 reporting year were DEFRA 2020/DECC and GHGP*4. For 2020, the Fourth Assessment Report of the Intergovernmental Panel on Climate Change (IPCC) was used, as well as the German Environment Agency and the EcoCockpit of the Effizienz-Agentur NRW, acting on behalf of the Ministry for the Environment, Agriculture, Nature Conservation and Consumer Protection of the State of North Rhine-Westphalia.
*3 The calculation of greenhouse gas emissions (GHG) includes all six main greenhouse gases defined by the Intergovernmental Panel on Climate Change (IPCC) and the Kyoto Protocol: carbon dioxide (CO2), methane (CH4), nitrous oxide (N2=), chlorofluorocarbons (CFCs), perfluorocarbons (PFCs) and sulphur hexafluoride (SF6). For a better overview, these different greenhouse gases are converted and presented in CO2 equivalents (CO2e) by the defined greenhouse gas potentials (Global Warming Potential).
*4 DEFRA – Department for Environment, Food & Rural Affairs, United Kingdom; DECC – Department of Energy & Climate Change, United Kingdom; GHGP – Greenhouse Gas Protocol.
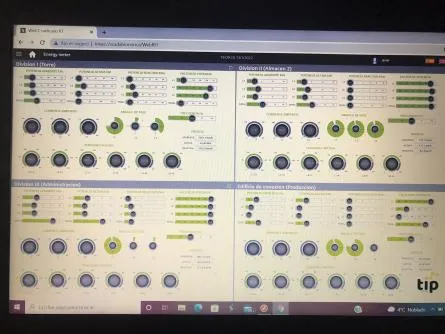
Energy consumption monitoring for production, laboratory, office and warehouse at the Bionorica extraction site in Consell, Majorca © Bionorica SE
Indirect energy-related GHG emissions (Scope 2)
| Indirect GHG emissions (Scope 2) | Key figures |
|---|---|
| Gross volume of indirect GHG emissions in the 2021 reporting year | 207 tonnes CO2e*1 |
| Gross volume of indirect GHG emissions in the base year (2019) | 1,511 tonnes CO2e*2 |
| Percentage change 2019 to 2021 | −86% |
*1 Scope 2: Germany and EU sites in the 2021 reporting year, CO2e = CO2 equivalents
*2 Source: CO2 Report Bionorica 2019, EcoCockpit
The decline in indirect GHG emissions in the reporting year 2021 compared to the base year is due to the climate-neutral purchase of electricity at the main location in Neumarkt and the energy saving projects (see GRI 302-4: “Reduction of energy consumption”). The sources and calculation bases/methods are the same as for direct GHG emissions.
Other indirect GHG emissions (Scope 3)
| Other indirect GHG emissions (Scope 3) | Key figures |
|---|---|
| Gross volume of other indirect GHG emissions in the 2021 reporting year | 1,985 tonnes CO2e*1 |
| Gross volume of other indirect GHG emissions in the base year (2019) | 1,662 tonnes CO2e*2 |
| Percentage change 2019 to 2021 | 19% |
*1 Scope 3: Only selected categories at the main business location in Neumarkt, CO2e = CO2 equivalents
*2 Source: CO2 Report Bionorica 2019, EcoCockpit
In the case of air travel, 657.78 tonnes of CO2 were saved in 2021, as there were fewer business trips due to the coronavirus situation. Even after the pandemic, the volume of air travel will not reach the level of 2019, for example, as modern video conferencing systems and digital exchange and collaboration platforms are used throughout the company at Bionorica, which has rendered many business trips unnecessary.
The increase in other indirect GHG emissions is due to the fact that the new DEFRA values have been used as the basis for calculations from 2021 onwards. These values are more accurate compared to the values from the base year 2019. However, additional GHG emissions in Scope 3 are also attributed to the energy sources from Scope 1 due to upstream and downstream process chains, e.g. delivery and transport.
At Bionorica, other indirect GHG emissions result, for example, from air and rail travel, or the consumption of printer paper. The sources and calculation bases/methods are the same as for direct GHG emissions.
Reduction of GHG emissions
Bionorica SE saved a total of 1,284 tonnes of CO2e in Scope 2 (indirect energy-related GHG emissions) in the 2021 reporting year. The reduction was achieved through the purchase of climate-neutral electricity at the main location in Neumarkt, as well as through energy saving projects (see GRI 302-4: “Reduction of energy consumption”). Everything that could not be reduced was compensated by certificates, i.e. through the purchase of CO2 certificates for unavoidable emissions. This purchase was realised in 2021 through two certified programmes:

- Kariba Forest Protection project, Zimbabwe
- Kamuthi Solar Power Project, Kamuthi, India
Greenhouse gases in CO2e were included in the calculation. The base year used is 2019, as this was the first year in which a CO2 report was prepared for Bionorica with the help of an external service provider. This service provider’s calculation table was used to calculate the reduction of GHG emissions.
Project Description © Infinite Solutions